Kinross Gold Finds Support at 200-Day Moving Average
Kinross Gold stock pulled back 2.8% to $28.18 but found support at the 200-day moving average, a level that historically led to gains 83% of the time with an average 7% return in the following month.
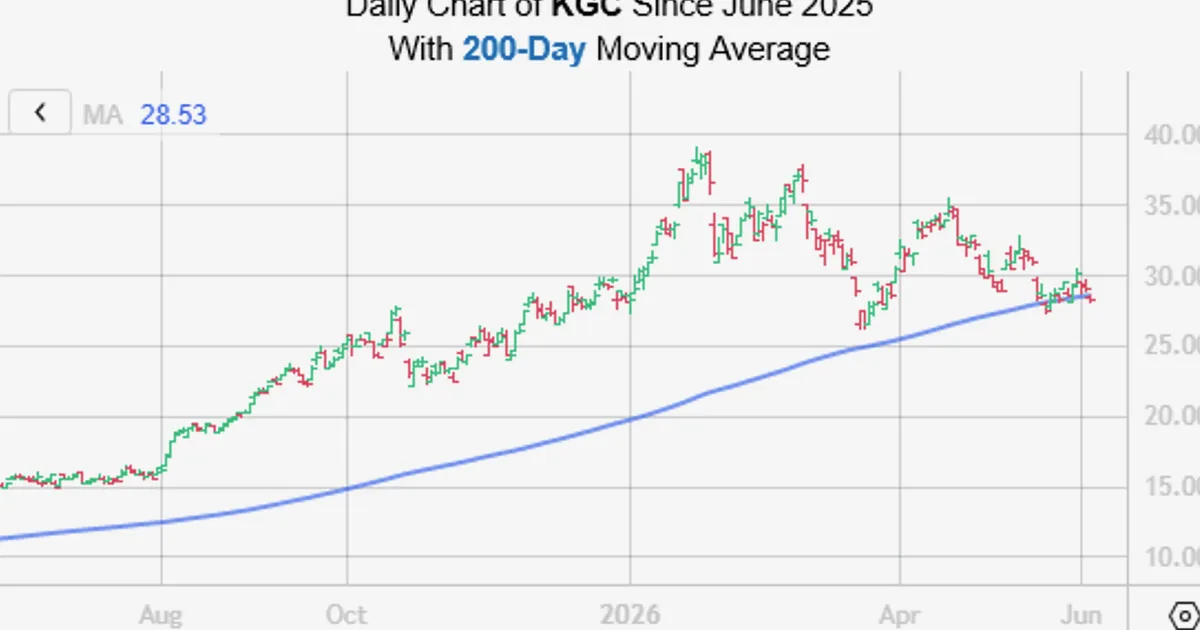
Kinross Gold Corporation (NYSE: KGC) shares fell 2.8% to $28.18 on Wednesday, tracking a broader pullback in precious metals stocks. The decline brought the stock to test its 200-day moving average, a widely watched technical level that has acted as support in the past.
For gold and precious metals traders, the 200-day moving average is a key indicator of long-term trend strength. When a stock holds above this level, it suggests the underlying uptrend remains intact. According to Schaeffer's Senior Quantitative Analyst Rocky White, KGC is currently trading within 0.75 times the 200-day moving average's 20-day average true range (ATR), after spending at least 80% of the previous two weeks and 80% of the prior 42 trading sessions above that trendline. This specific setup has occurred only seven times in the past decade. One month after these signals, the stock was higher 83% of the time, averaging a 7% gain. Live gold prices and charts on NowPrice show how the broader precious metals sector is reacting to these technical developments.
Looking ahead, traders will watch whether KGC can hold above the 200-day moving average and confirm the bullish signal. A close below this level could open the door to further downside, while a bounce would reinforce the historical pattern. Key catalysts include upcoming gold price movements, U.S. economic data, and Federal Reserve policy expectations, all of which influence precious metals stocks.