 Live Stock Indices
World indices and regional tickers — quotes during local market hours, last close otherwise
World indices
United States
Europe
Asia-Pacific
Emerging markets
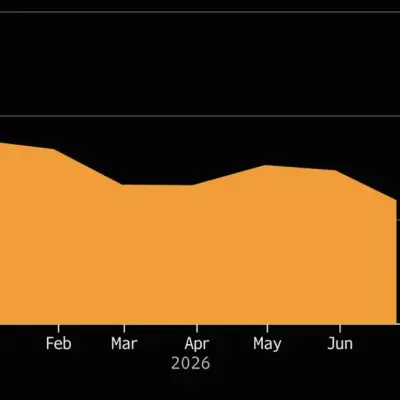
Price history
Compare countries
Benchmark index per country — last price, 24h move and year-to-date return.
🇺🇸United StatesS&P 500
Best YTD
- 🇰🇷South Korea▲ +74.40%
- 🇹🇼Taiwan▲ +39.33%
- 🇯🇵Japan▲ +17.32%
- 🇧🇷Brazil▲ +10.42%
- 🇺🇸United States▲ +8.02%
Worst YTD
- 🇮🇩Indonesia▼ -25.94%
- 🇮🇳India▼ -12.35%
- 🇫🇷France▼ -4.02%
- 🇩🇪Germany▼ -2.92%
- 🇭🇰Hong Kong▼ -2.63%
About stock indices
Stock indices summarize the performance of a basket of stocks — the S&P 500 tracks the 500 largest US companies, the FTSE 100 the largest London-listed firms, the Nikkei 225 the 225 largest Japanese names. Prices shown are indicative and may be 15 minutes delayed; verify with your broker before trading.
Latest news
See all →
Bed Bath & Beyond Gets Bullish Call on Home Transformation
Bed Bath & Beyond shares rose after an analyst initiated coverage with a buy rating, citing the company's pivot to a comprehensive home improvement and financing destination.
Top analyst calls: SpaceX, Nvidia, Apple, Tesla, Crocs, Microsoft, Robinhood
Wall Street analysts issued key calls on Friday covering SpaceX, Nvidia, Apple, Tesla, Crocs, Microsoft, and Robinhood, offering fresh ratings and price targets that could influence trading.
Bitcoin Bottom Hunters Fear Fresh Pain After $1.3 Trillion Rout
Bitcoin's $1.3 trillion rout has bottom hunters questioning whether the selloff has further to go, as veterans warn that panic has not yet reached capitulation levels.

SpaceX Bond Losses Stun Traders as Debt Worsens Rapidly
SpaceX's recent bond sale is rapidly losing value in secondary markets, with traders noting the speed of widening is unprecedented for a high-profile deal.

Boeing Wins $3.62B Jet Deal From China Southern Airlines
Boeing secures a $3.62 billion order from China Southern Airlines, its first major deal from China in years, signaling a potential thaw in trade tensions.
Frequently asked questions
Which indices does NowPrice cover?
26 benchmark indices across 23 countries: S&P 500, Nasdaq, Dow Jones, Russell 2000 (US); FTSE 100 (UK); DAX (Germany), CAC 40 (France), IBEX 35 (Spain), FTSE MIB (Italy), AEX (Netherlands), SMI (Switzerland), PSI (Portugal), Euro Stoxx 50 (Eurozone); Nikkei 225 (Japan), Hang Seng (Hong Kong), KOSPI (South Korea), Sensex (India), ASX 200 (Australia), Straits Times (Singapore), JKSE (Indonesia), TWSE (Taiwan), Shanghai Composite (China); Bovespa (Brazil), TSX (Canada), IPC (Mexico), JSE (South Africa). All from Yahoo Finance every 5 minutes.
When are markets open?
Each market follows local trading hours: NYSE/Nasdaq 09:30–16:00 ET, LSE 08:00–16:30 GMT, Tokyo 09:00–15:00 JST, etc. Prices outside session hours are the most recent close. Holidays vary by exchange — check the local calendar.
Why is the change percentage different from another site?
Some sites show change vs. the previous calendar day; others show change vs. the previous trading day (skipping weekends/holidays). NowPrice uses the previous close as published by Yahoo Finance, which is the standard daily-change definition.
How is the year-to-date (YTD) figure calculated?
YTD compares today's price to the first non-null close of the current calendar year for each index. The Jan-1 anchor is fetched once per index per year, so the figure stays accurate even on holidays. Hidden when the anchor isn't yet populated for a market.